Documentation

It looks like you're diving into the "aesthetic" side of engineering documentation—where the goal is to make a MATLAB script look like a professional textbook. Those diagrams and the Live Editor layout are a classic mix of high-end vector graphics and MATLAB's native formatting capabilities.
Here is how you can replicate and integrate this into your professional workflow.
1. How these diagrams are created
The two diagrams you shared use different styles, likely originating from two different tools:
-
The Flexible Beam (Figure 4): This is almost certainly created using TikZ or PGFPlots (LaTeX packages). The mathematical font consistency (the
and ) is a dead giveaway. -
The Piston Schematic: This is a standard vector illustration. Professionals usually create these in:
-
Inkscape (Free): Great because it has a "LaTeX formula" plugin that lets you render math labels directly into the SVG.
-
Affinity Designer / Adobe Illustrator: Used for high-polish schematics.
-
GeoGebra: Surprisingly good for geometry-heavy diagrams where you need to ensure lengths and angles are mathematically "true" before exporting as an image.
-
Pro-tip for you: Since you already use VSCode and LaTeX Workshop, stick with TikZ. You can write the code for the diagram in a .tex file, compile it to a tight PDF/PNG, and then drag it into your MATLAB Live Script.
2. Icons and Formatting in the Live Editor
The "Green Icon" and the "Summary" block aren't special MATLAB widgets; they are clever uses of the Live Editor’s rich text features:
-
Icons: You can simply copy-paste any transparent
.pngor.svgicon (like from Bootstrap Icons) directly into a text line in the Live Editor. -
Background Shading: That grey "Summary of results" block is created by selecting text and using the "Section Break" or "Text Color/Background" options in the Live Editor ribbon.
-
LaTeX in MATLAB: You don't need to guess the syntax. In the Live Editor, go to Insert > Equation > LaTeX Equation. This lets you write standard LaTeX math that renders beautifully right next to your code.
3. Integration with your LaTeX Workflow
Since your final deliverable is a Technical Report (PDF), you want a "Single Source of Truth." Here is the professional way to bridge MATLAB and LaTeX:
The "Matlab-to-LaTeX" Export
You can export your entire .mlx (Live Script) directly to LaTeX:
-
In the Live Editor, go to Save > Export to LaTeX.
-
It will generate a
.texfile and a folder with all the images. -
You can then
\input{}this into your main report in VSCode.
Dynamic LaTeX Labels
For Method 1 (Analytical Modeling), use the latex() function to avoid transcription errors:
Matlab
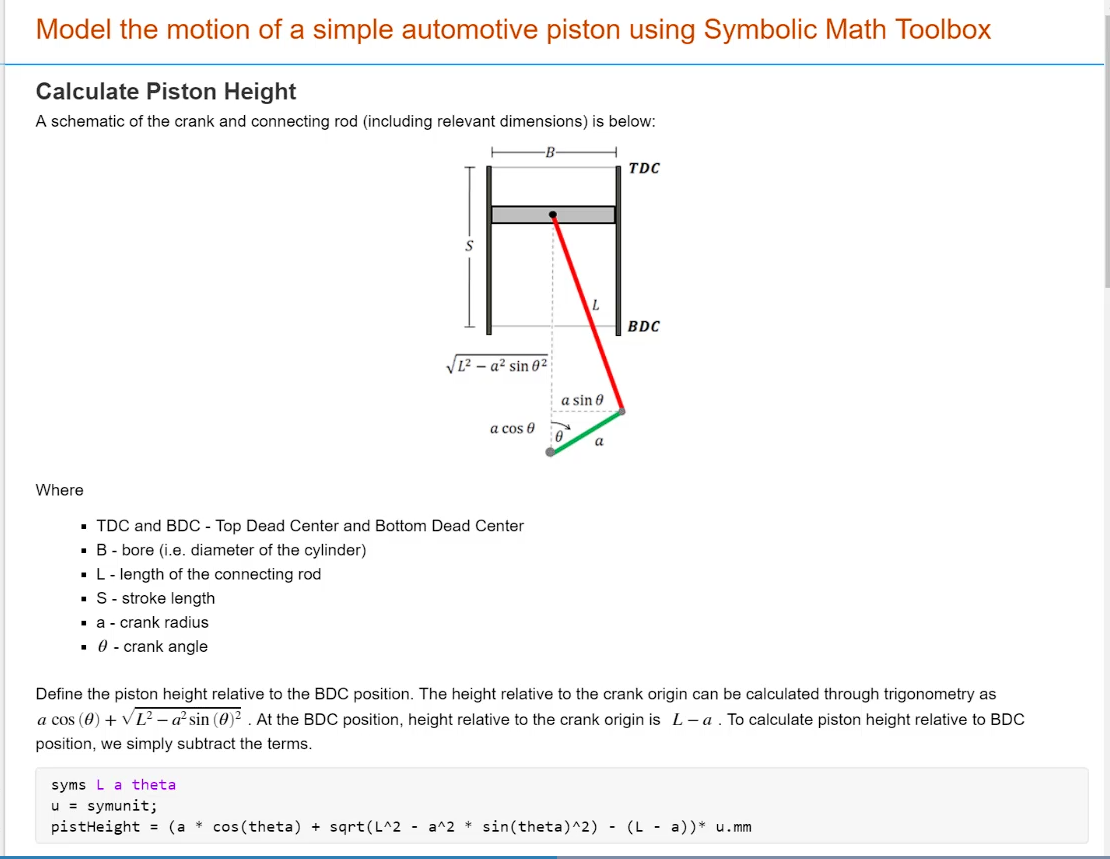
syms L a theta
pistHeight = (a * cos(theta) + sqrt(L^2 - a^2 * sin(theta)^2) - (L - a));
texEq = latex(pistHeight); % Generates the LaTeX code for this equation
You can then copy texEq and paste it into your report. This ensures that the math in your report is identical to the math in your code.
The VSCode Bridge
While you can't run a .mlx file directly inside VSCode, the MATLAB Extension for VSCode (by MathWorks) allows you to run .m files and see plots in a side panel. However, for the "Textbook" look, the Live Editor is still superior for the drafting phase.
Recommended Design Paradigm: "Literate Programming"
Treat your Live Script as a story.
-
Text Block: Explain the physics (using TikZ diagrams).
-
Math Block: Show the analytical derivation (using LaTeX equations).
-
Code Block: Implement the math.
-
Result Block: Plot the comparison.
Since you are working with a real robotic arm, are you planning to use a CAD model (like from SolidWorks) to generate the visual representation in your Simscape environment, or will you stick to basic geometric primitives?